
Imagine you are the captain of a ship sailing through a thick fog. You cannot see the water and you cannot see the other ships. You cannot even see your own speed.
For a long time running a voice operation felt exactly like that. Managers knew calls were happening but they had no idea what was actually going on inside them until hours or days later. They were flying blind.
Today the fog has lifted. Modern technology allows us to see everything as it happens. By integrating a voice calling API and SDK into your software you gain a dashboard full of live data. You can see who is talking and how they are feeling and if the connection is good or bad.
This visibility changes everything. It turns the phone system from a black box into a clear engine of data. In this article we will explore exactly which metrics become visible when you switch to live call analytics. We will look at operational numbers and quality scores and behavioral insights and how platforms like FreJun AI provide the infrastructure to capture this data with precision.
Table of contents
- What Are Live Call Analytics?
- Why Is Real Time Visibility Crucial?
- Which Operational Metrics Can You See?
- Which Quality Metrics Become Visible?
- Which Behavioral Metrics Can You Track?
- How Does an Intelligent Routing API Use These Metrics?
- How Does a Skills Based Calling SDK Improve Performance?
- The Role of Infrastructure in Data Accuracy
- How to Access These Metrics (The Technical View)
- Conclusion
- Frequently Asked Questions (FAQs)
What Are Live Call Analytics?
Live call analytics involves the extraction and visualization of data from phone calls while they are still active.
In the old days businesses relied on “historical reporting.” The manager would get a PDF report on Monday showing what happened last week. That is like checking the weather report for yesterday. It is useless for changing the outcome today.
Live analytics uses the voice calling API and SDK to tap into the data stream in real time. It captures signaling data (who is calling), media data (audio quality), and content data (what is being said).
Why Is Real Time Visibility Crucial?
You cannot fix a problem you do not know about. If a customer is angry right now knowing about it tomorrow does not help. You need to know now so you can step in.
Speed is the currency of the contact center. According to a report by Salesforce, 83% of customers expect to interact with someone immediately when they contact a company. If you do not have visibility into your wait times and agent availability in real time you cannot meet this expectation.
Live metrics allow you to be proactive. Instead of reacting to a disaster after it happens you can prevent it. If you see queue times spiking you can add more agents instantly. If you see audio quality dropping you can switch routes.
Also Read: How Does a Voice API for Developers Help Build Smarter Voice Workflows?
Which Operational Metrics Can You See?
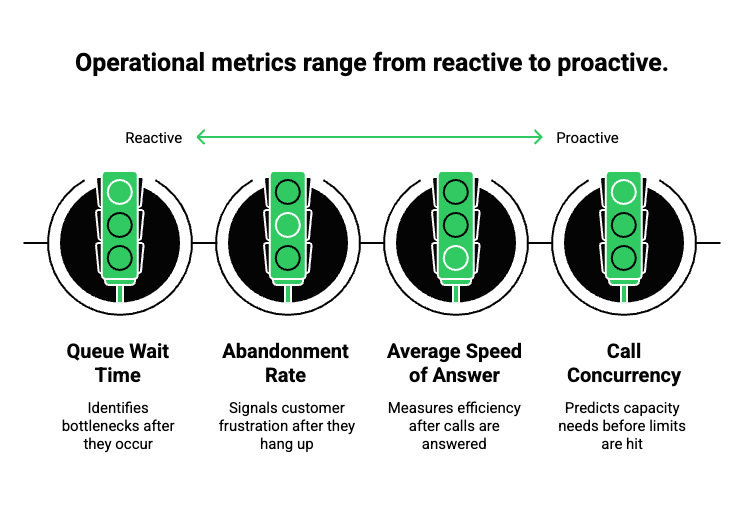
These are the numbers that tell you the health of your system. They answer the question “Is everything working?”
Call Concurrency
This tells you how many calls are happening at this exact second. It is vital for capacity planning. If you hit your limit customers get busy signals. FreJun uses FreJun Teler which provides elastic SIP trunking. This means we give you visibility into your concurrency and we automatically scale it up so you never hit a ceiling.
Queue Wait Time
This measures how long customers are waiting on hold before an agent picks up. Watching this in real time allows managers to spot bottlenecks instantly.
Average Speed of Answer (ASA)
This is the average time it takes for a call to be answered. A low ASA means your team is efficient. A high ASA means you are understaffed.
Abandonment Rate
This tracks how many people hang up before speaking to anyone. If this number creeps up live it is a red alert. It means customers are frustrated and you are losing revenue.
Here is a comparison of what you see with and without live APIs.
| Metric | Without Live API (The Fog) | With Live API (The Dashboard) |
| Volume | “It feels busy today” | “We have 45 active calls right now” |
| Quality | “The line sounds bad” | “Jitter is 45ms on Trunk A” |
| Mood | Unknown | “Customer in Queue 3 is angry” |
| Agent Status | Walking around checking | “Agent Mike is Idle for 5 mins” |
| Outcome | Review logs tomorrow | Predict sales success now |
Which Quality Metrics Become Visible?
The content of the call does not matter if the audio is garbage. A robust voice calling API and SDK exposes the technical health of the call.
Jitter and Latency
Jitter is the variation in packet arrival time. Latency is the delay. If these numbers get too high the voice sounds robotic or choppy. FreJun provides deep visibility into these network stats. Because our infrastructure is optimized for low latency media streaming we help you keep these numbers low and we show you exactly when they spike so you can troubleshoot.
Packet Loss
This tells you what percentage of voice data is getting lost in transit. Even a 1% loss can make a conversation hard to understand.
Mean Opinion Score (MOS)
This is an automated score from 1 to 5 that rates the quality of the call. A score of 4.5 is perfect. A score of 2.0 is terrible. Seeing this live allows you to disconnect a bad line and route the call through a better path immediately.
Which Behavioral Metrics Can You Track?
This is where things get futuristic. By combining the audio stream with AI we can see metrics about human behavior.
Sentiment Score
By analyzing the tone of voice and the words used an AI can determine if a customer is Happy, Neutral, or Angry. This is often powered by an intelligent routing API. If the system detects “Anger” it can alert a supervisor to barge in and save the call.
Talk to Listen Ratio
Are your sales agents listening or are they just talking over the customer? This metric shows the percentage of time the agent speaks versus the customer. A good salesperson usually listens more than they talk.
Dead Air (Silence)
Long periods of silence are bad. It means the agent does not know the answer or the system is slow. Tracking dead air helps identify training gaps.
How Does an Intelligent Routing API Use These Metrics?
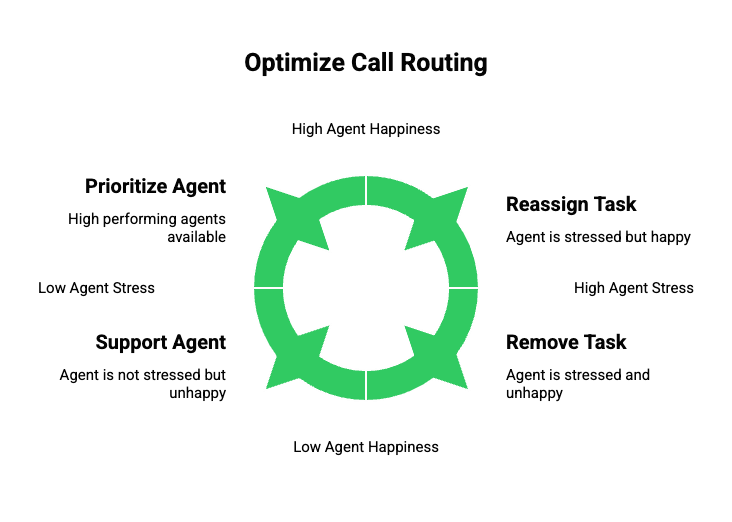
Seeing the data is good. Acting on it is better. An intelligent routing API takes these live metrics and makes decisions automatically.
For example imagine you have two agents. Agent A is an expert at closing deals but is currently on a high stress call. Agent B is new.
A traditional system would just route the next call to whoever is free. An AI system looks at the metrics. It sees Agent A is “Stressed” (based on voice analysis) and Agent B has a high “Happy” score. It routes the new call to Agent B to give Agent A a break.
This dynamic decision making is often called AI routing. It uses the live data to optimize the workforce in real time ensuring the best possible outcome for every call.
Also Read: How Programmable SIP Simplifies Voice Application Deployment?
How Does a Skills Based Calling SDK Improve Performance?
A skills based calling SDK allows developers to tag agents with specific abilities.
- “Fluent in Spanish”
- “Expert in Refunds”
- “Certified for VIPs”
When a call comes in the system looks at the caller’s profile and matches them to the best available agent who has the required tags.
But with live analytics this goes deeper. You can dynamically update skills. If Agent Steve is closing sales rapidly today the system can temporarily tag him as “Hot Hand” and route more high value leads to him. If his metrics drop the tag is removed. This creates a fluid and high performing team structure.
The Role of Infrastructure in Data Accuracy
You might wonder why the voice provider matters for analytics. The answer is simple. Garbage in garbage out.
If your voice infrastructure introduces static or noise the analytics engine will fail. The sentiment analysis will read “Angry” when it is just static. The transcription will be full of errors.
FreJun AI is the foundation of accurate analytics. We handle the complex voice infrastructure so you can focus on building your AI.
- Clean Audio: We ensure high definition audio capture which improves the accuracy of AI models.
- Real Time Streams: We push data instantly via webhooks. There is no delay. You see the metric the millisecond it happens.
- Reliability: With FreJun Teler providing stable connections you do not get false “dropped call” alerts caused by poor carrier handoffs.
Ready to turn the lights on in your contact center? Sign up for FreJun AI to access real time call insights.
How to Access These Metrics (The Technical View)
For the developers reading this accessing this data is usually done through two methods.
Webhooks
This is the push method. You tell the FreJun system “When a call ends send the data to this URL.”
The payload will look like this:
{ “call_id”: “123”, “duration”: 60, “mos_score”: 4.5, “sentiment”: “positive” }
Polling API
This is the pull method. Your dashboard asks the FreJun API every second “What is the current status of Agent X?” The API replies with the live state.
Combining these allows you to build those big TV dashboards you see in command centers.
Also Read: Top 5 Use Cases of Programmable SIP for AI Voice Agents in 2026
Conclusion
The era of the black box phone system is over. Today business moves too fast for historical reports. You need to know what is happening right now.
Implementing a voice calling API and SDK opens up a world of data. It reveals the operational heartbeat of your center and exposes the technical quality of your network. It unlocks deep behavioral insights about your customers and agents.
By leveraging intelligent routing API capabilities and skills based calling SDK features you can turn this data into action. You can route calls smarter and fix quality issues faster and train your team better.
However this data is only as good as the network it travels on. FreJun AI provides the crystal clear, low latency infrastructure required to capture accurate metrics. We make the invisible visible so you can run your business with confidence.
Want to see these metrics in action? Schedule a demo with our team at FreJun Teler and let us show you the power of live call analytics.
Also Read: Scaling Customer Communication in Yemen with a Centralized WhatsApp Business Interface
Frequently Asked Questions (FAQs)
Historical analytics look at past data (yesterday, last week). Live analytics look at what is happening right now (active calls, current wait times). Live analytics allow for immediate problem solving.
Yes. By using AI integrated with the voice stream you can analyze the tone and words of the customer to determine if they are happy or angry while the call is still happening.
MOS stands for Mean Opinion Score. It is a standard metric from 1 to 5 that rates the audio quality of a call. A voice calling API and SDK can calculate this automatically for every call.
FreJun provides the raw real time data via APIs and webhooks. You can feed this data into your own custom dashboard or third party visualization tools like Grafana or Tableau to build the view you need.
FreJun Teler provides elastic SIP trunking. It gives you visibility into carrier level metrics like call deliverability and trunk capacity ensuring you know exactly how your telecom network is performing.
Tracking silence or “dead air” helps identify training issues. If an agent has long pauses it might mean they do not know how to use the software or they lack product knowledge.
Yes. With an intelligent routing API you can detect if a specific carrier route has poor quality (low MOS) and automatically switch traffic to a backup route to maintain standards.
This metric shows what percentage of time an agent spends actually talking to customers versus waiting or doing admin work. High utilization means high productivity.