
You have built a beautiful application. The user interface is sleek. The features are innovative. You recently added a calling feature so your users can talk to each other directly within the app. You launch it to the world and wait for the praise to roll in.
Instead you get support tickets.
“The audio is choppy.”
“I called but nobody heard me.”
“The call dropped after ten seconds.”
You look at your server logs. Everything says “200 OK.” Your API requests are succeeding. So why are your users unhappy?
This is the classic nightmare of voice development. Voice is different from standard web traffic. It is sensitive and invisible and unforgiving. If a web page loads half a second late nobody notices. If voice audio arrives half a second late the conversation is ruined.
To fix these problems you cannot rely on guesswork. You need the right tools. You need to monitor your voice API integration with the same rigor that you monitor your database or your payment gateway.
In this guide we will explore the specific tools developers use to keep their voice applications healthy. We will look at the key metrics you must watch and how to debug invisible errors and how infrastructure platforms like FreJun AI provide the essential visibility you need to deliver a crystal clear voice experience.
Table of contents
- Why Is Monitoring Voice Different from Web Monitoring?
- What Are the Key Metrics You Must Watch?
- The First Line of Defense: The Provider Dashboard
- Network Protocol Analyzers (The Microscope)
- Application Performance Monitoring (APM)
- Synthetic Monitoring Tools
- Visualization: Putting It All Together
- How FreJun Teler Simplifies Debugging
- Why Real Time Alerting Is Critical
- The Role of Customer Feedback Loops
- How to Debug a “Ghost Call”
- Conclusion
- Frequently Asked Questions (FAQs)
Why Is Monitoring Voice Different from Web Monitoring?
Most developers are used to monitoring HTTP requests. You send a request and you get a response. It is a simple transaction.
Voice is a stream. It is a continuous flow of data packets moving in real time.
When you implement a voice API integration you are actually managing two different things.
- Signaling: This is the setup. It is like dialing the phone number. This part looks like standard web traffic (SIP or HTTP).
- Media: This is the conversation. It is the actual audio data (RTP) flowing between two people.
Standard web monitoring tools are great at checking the Signaling. They can tell you if the call connected. But they are often blind to the Media. They cannot tell you if the audio was robotic or if there was an echo.
This is why you need specialized tools. You need visibility into the network layer and the transport layer.
What Are the Key Metrics You Must Watch?
Before we look at the tools we need to know what we are measuring. There are four horsemen of bad voice quality.
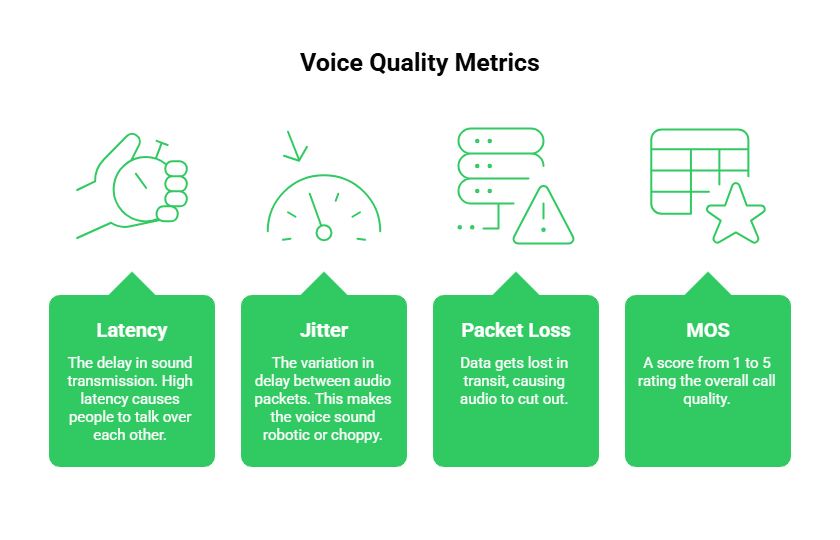
1. Latency
This is the delay. It is the time it takes for sound to travel from the speaker’s mouth to the listener’s ear. High latency causes people to talk over each other.
2. Jitter
This is the variation in delay. If some audio packets arrive fast and others arrive slow the voice sounds robotic or choppy. This is the most common complaint in VoIP.
3. Packet Loss
This happens when data gets lost in transit. In a text message the system just resends it. In a live voice call there is no time to resend. The audio just cuts out.
4. MOS (Mean Opinion Score)
This is the report card. It is a score from 1 to 5 that rates the overall quality of the call.
- 5: Perfect
- 1: Impossible to understand
Your monitoring tools need to track these four metrics for every single call.
Also Read: How Is Edge Computing Accelerating Building Voice Bots For Real-Time Calls?
The First Line of Defense: The Provider Dashboard
The most important tool in your arsenal is the one provided by your infrastructure partner. You should not have to build monitoring from scratch.
FreJun AI is designed with this in mind. We handle the complex voice infrastructure so you can focus on building your AI. Part of handling that infrastructure means giving you full visibility into it.
When you use FreJun Teler for your SIP trunking and voice transport you gain access to detailed logs.
- Call Logs: See exactly when a call started and ended and why it ended. Did the user hang up or did the network drop?
- Error Codes: We provide specific SIP error codes. A “404 Not Found” means the number was wrong. A “486 Busy Here” means the user was on another call.
- Quality Stats: We track the health of the media stream.
For 90% of issues your provider’s dashboard is the only tool you need. It allows you to triage problems instantly.
Ready to get better visibility into your calls? Sign up for FreJun AI to access our analytics dashboard.
Network Protocol Analyzers (The Microscope)
Sometimes the dashboard says everything is fine but the audio is still bad. This is when developers pull out the heavy machinery.
The most famous tool in this category is Wireshark.
Wireshark is a network protocol analyzer. It lets you capture the actual data packets flying through the network wire. It is like putting the call under a microscope.
How Developers Use It
If you are facing a complex issue like “one way audio” (where you can hear them but they cannot hear you) Wireshark is essential. You can visualize the flow of RTP packets. You can see if the packets are leaving your server but being blocked by a firewall before they reach the internet.
While Wireshark is powerful it is also manual. You usually use it to debug one specific bad call rather than monitoring all calls globally.
Application Performance Monitoring (APM)
You likely already use tools like Datadog or New Relic or Sentry to monitor your web apps. These tools are also vital for voice API integration.
While they might not analyze the audio quality they monitor the logic of your integration.
What They Monitor
- API Latency: How long does it take your server to respond to a webhook? If your server is slow to tell the voice API what to do the caller hears dead silence.
- Webhook Failures: Did the voice provider try to tell you a call started but your server crashed? APM tools catch these errors.
- Business Logic Errors: Did your code try to play a sound file that does not exist?
Connecting your voice logs to a tool like Datadog allows you to see the bigger picture. You can correlate a spike in database errors with a spike in dropped calls.
Synthetic Monitoring Tools
How do you know if your phone lines are working at 3:00 AM? You cannot have a human tester awake 24 hours a day.
This is where synthetic monitoring comes in. These are tools that use robots to make test calls.
How It Works
A tool like Spearline or TestRTC will initiate a real phone call to your support number every 15 minutes.
- The robot dials the number.
- It waits for an answer.
- It plays a test tone.
- It listens for a response.
- It measures the audio quality of that response.
If the call fails or the audio quality drops below a certain threshold the tool sends you an alert immediately. This allows you to fix issues before your actual customers even notice them.
Visualization: Putting It All Together
Data is useless if you cannot understand it. The best developers create a unified view of their voice performance.
Here is how different tools stack up for different tasks.
| Tool Category | Example Tool | What It Monitors | When To Use It |
| Infrastructure Dashboard | FreJun Dashboard | Call logs and costs and error codes | First step for debugging any issue |
| APM | Datadog / New Relic | API latency and server errors | Monitoring your application code |
| Packet Analyzer | Wireshark | Deep packet inspection | Debugging complex network issues |
| Synthetic Tester | Spearline | Uptime and audio quality | Proactive 24/7 monitoring |
| Log Aggregator | ELK Stack | Custom log storage | Long term trend analysis |
Also Read: How Can Companies Enable Real-Time Interruptions While Building Voice Bots?
How FreJun Teler Simplifies Debugging
One of the hardest parts of monitoring is the “Black Box” of the carrier network. Once the call leaves your server and enters the public telephone network you usually lose visibility.
FreJun Teler changes this. Because we provide elastic SIP trunking we give you visibility into the carrier level signaling.
If a call fails because a local carrier in France is down standard tools just show “Call Failed.” FreJun Teler can provide the specific SIP trace that shows exactly where the failure happened. This allows you to tell your customer “The issue is with the local network in Paris” rather than saying “We do not know what happened.”
Why Real Time Alerting Is Critical
You never want your CEO to be the one to tell you the phones are down. You want your monitoring tools to tell you first.
Effective voice API integration requires setting up alerts based on thresholds.
Good Alert Rules
- ASR (Answer Seizure Rate) Drop: If the percentage of answered calls drops below 50% trigger an alert.
- Jitter Spike: If average jitter exceeds 30ms for more than 5 minutes alert the engineering team.
- Webhook Timeout: If your webhook response time goes above 1000ms alert the backend team.
FreJun allows you to configure webhooks for call states. You can feed these webhooks into your internal Slack channels or PagerDuty to ensure the right person knows about the problem instantly.
The Role of Customer Feedback Loops
Finally the ultimate monitoring tool is the user.
Sometimes the metrics look green but the user is still unhappy. Perhaps the volume is too low. Perhaps the accent of the Text to Speech voice is hard to understand.
Developers often build a “Rate This Call” feature into their app. After a call ends a popup asks the user “How was the call quality?” with a 1 to 5 star rating.
If a user rates a call 1 star you should capture that event. Combine it with the technical logs from FreJun. Look at the jitter and latency for that specific call. This helps you correlate human perception with technical data.
How to Debug a “Ghost Call”
A common issue developers face is the “Ghost Call.” This is when the phone rings but nobody is there. Or the call connects but there is no audio.
How to Monitor for This
- Check the Duration: If you see a spike in calls with a duration of 0 to 3 seconds you likely have a ghost call issue.
- Check the Codec: Use your logs to see which audio codec was negotiated. If the two sides cannot agree on a codec (e.g. one speaks G.711 and the other speaks Opus) audio will fail.
- Check FreJun Logs: Look for “Media Timeout” errors. This means the call connected but no audio packets were received.
Also Read: Why Do Developers Prefer a Flexible Voice Recognition SDK Today?
Conclusion
Building a voice feature is easy. Maintaining a high quality voice experience is hard. It requires vigilance. It requires data.
By using the right mix of tools you can turn the invisible world of voice networking into something you can see and control. You need APM for your code and network analyzers for your packets and synthetic testers for your uptime.
But most importantly you need a partner that gives you a solid foundation.
FreJun AI provides the robust infrastructure that makes monitoring easy. With FreJun Teler providing transparent access to SIP signaling and our low latency media network ensuring high quality transport we give you the data you need to solve problems fast. We handle the heavy lifting so you can keep your promise of a great user experience.
Want to see our analytics tools in action? Schedule a demo with our team at FreJun Teler and let us help you build a voice stack you can trust.
Also Read: AI vs. Rule-Based Call Routing: Which One Should You Choose?
Frequently Asked Questions (FAQs)
MOS (Mean Opinion Score) is the most important because it represents the overall human experience. However Jitter is the technical metric that most often destroys that experience.
Not really. Google Analytics is for web page traffic. It can track that a “Call Button” was clicked but it cannot tell you if the audio quality of that call was good or bad.
A SIP trace is a log of the messages sent between your system and the phone network to set up a call. It shows the “Invite” and “Ringing” and “Connected” and “Bye” messages. It is essential for debugging connection errors.
FreJun uses a premium global network with optimized routing. By sending calls over high quality paths rather than the congested public internet we minimize the chance of packet loss occurring.
No. Wireshark is complex and time consuming. You should only use it for deep network debugging when your provider dashboard does not give you enough information.
Synthetic monitoring is using a software robot to simulate user actions. In voice this means a robot making a phone call to verify that the line is working and the audio is clear.
This is usually a bandwidth or jitter issue. 4G networks are more unstable than Wi-Fi. You need to monitor how your app performs under different network conditions and perhaps use an adaptive codec like Opus to handle the instability.
It does not have to be. Most infrastructure providers like FreJun include basic logs and analytics for free. Third party tools like Datadog or Spearline charge extra but pay for themselves by preventing downtime.