
You’ve done it. After weeks of careful development, your voice AI application is live. The code is elegant, the AI is intelligent, and the initial user feedback is fantastic. But then, a support ticket arrives. A high-value customer reports that a call was “choppy and hard to hear.” Another user says the AI’s response was “slow and laggy.” Your application, which worked perfectly in the clean, predictable environment of your development machine, has just collided with the chaotic, unpredictable reality of the global telephone network.
Now, a new and urgent challenge begins: troubleshooting. How do you debug a problem that happened in a fleeting, real-time conversation? How do you find the digital needle in a haystack of millions of audio packets?
This is where monitoring and observability become the most critical, and often overlooked, aspects of a production-grade voice API for developers. It’s about moving beyond simply building your application and into the professional discipline of operating it. This guide is a deep dive into the tools, metrics, and strategies you need to monitor your voice API integration and troubleshoot problems like a seasoned expert.
Table of contents
Why is Voice API Monitoring a Unique and Difficult Challenge?
Monitoring a standard web application is a well-understood problem. You track server CPU, database query times, and API error rates. But a real-time voice application introduces a whole new dimension of complexity.
How Does the “Black Box” of the PSTN Complicate Things?
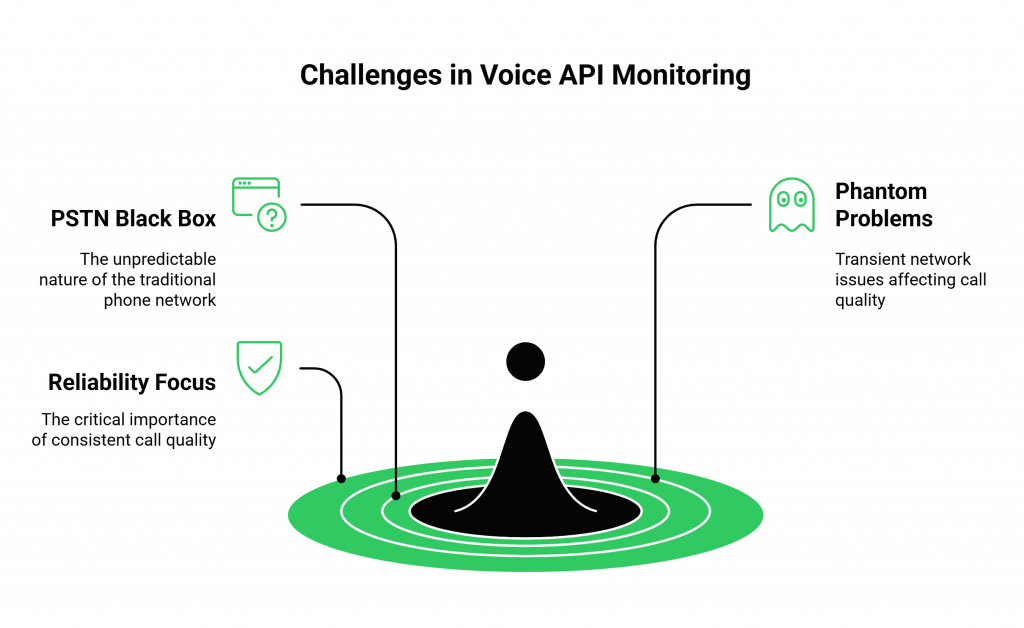
A significant portion of your call’s journey happens on the Public Switched Telephone Network (PSTN), the traditional phone network. This is a “black box” that is outside of your direct control. A problem with a user’s local carrier or a congested network path halfway across the world can degrade your call quality, even if your own application and your voice API provider are working perfectly.
What Are the “Phantom” Problems of Real-Time Communication?
The problems that affect a voice call are often transient and difficult to reproduce. Issues like jitter (the variation in packet arrival time) and packet loss are fleeting, millisecond-level network events. You can’t just “recreate the bug” in the same way you would with a standard web application. You need a system that is constantly monitoring the health of the live audio stream.
A recent report from Postman, which surveyed tens of thousands of developers, found that the top factor they consider when consuming an API is reliability. For a voice API, reliability isn’t just about uptime; it’s about the consistent quality of every single call.
Also Read: How Developers Can Use Teler and AgentKit to Build Human-Like Voice Agents
What Are the “Golden Signals” You Must Monitor?
To get a clear picture of your voice application’s health, you need to monitor a specific set of “golden signals.” These metrics, when tracked together, give you a comprehensive, end-to-end view of your system’s performance.
| Metric Category | Key Metrics to Monitor | What It Tells You |
| Telephony & Call Setup | Call Setup Time, Post-Dial Delay (PDD), Call Failure Rate | The health of the initial connection to the telephone network. Are your calls being connected quickly and reliably? |
| Audio Quality | Mean Opinion Score (MOS), Jitter, Packet Loss, Round-Trip Time | The real-time quality of the audio stream. Is the conversation clear and free of glitches, or is it choppy and laggy? |
| API & Application Health | Webhook Success Rate, API Latency (p95, p99), API Error Rate | The performance of your own backend application and its communication with the voice platform. Is your server responding quickly? |
| AI Performance | STT Word Error Rate (WER), LLM “Time to First Token”, TTS Latency | The performance of your AI “brain.” Is your AI thinking and speaking quickly, and is it hearing the user correctly? |
How Do You Measure the User’s Perceived Audio Quality?
The Mean Opinion Score (MOS) is the industry-standard metric for perceived audio quality. It’s a score from 1 (unintelligible) to 5 (perfectly clear), and it’s calculated by an algorithm that analyzes the audio stream for impairments like jitter, packet loss, and codec issues. An enterprise-grade voice API for developers will provide a MOS score for every single call leg, giving you a powerful, objective measure of your customers’ audio experience.
What is the Difference Between API Latency and End-to-End Latency?
- API Latency is the time it takes for your server to respond to a webhook or for the voice platform to respond to your API call.
- End-to-End Latency is the total, user-perceived delay from the moment they stop speaking to the moment the AI starts responding.
You must measure both. Low API latency is a prerequisite for low end-to-end latency, but you must also factor in the processing time of your entire AI pipeline.
Also Read: Why Are Businesses Shifting to AI Voice Agents?
What Tools and Features Should Your Voice API Provider Offer?
You cannot monitor what you cannot see. Your choice of a voice API for developers is the single most important factor in your ability to effectively monitor and troubleshoot your application. A “black box” provider that hides this data from you will leave you flying blind. A true, developer-first provider will treat you like a partner and give you the powerful observability tools you need.
This is a core part of the philosophy at FreJun AI. We believe that our customers should have a crystal-clear, “glass box” view into the performance of their voice infrastructure. We handle the complex voice infrastructure so you can focus on building your AI
Ready to gain deep, real-time visibility into your voice application’s performance? Sign up for FreJun AI!
What is Your “First Responder’s” Troubleshooting Playbook?
When you get an alert that something is wrong, you need a methodical, step-by-step process to diagnose the problem. Here is a simple playbook.

- Isolate the Scope of the Problem: Is this affecting all calls, or just calls from a specific region or carrier? Is it happening all the time, or only during peak hours? The analytics dashboard from your voice API provider is the key tool for this first step.
- Check the Voice Infrastructure Layer: The first place to look is your provider’s public status page. Is there a known, system-wide incident?
- Investigate the Call Detail Records: If there is no system-wide issue, dive into the CDRs for the specific calls that failed. Look at the MOS score and the network quality metrics. High jitter or packet loss might point to a problem with the user’s local network or a carrier issue.
- Analyze Your Application’s Logs: If the CDRs look clean, the problem is likely in your own application. Check your server’s logs. Are you seeing a high rate of webhook failures? Is the latency of your API responses to the webhooks high? Is your external LLM API timing out?
The ability to move through this diagnostic flow quickly is what separates a professional, operational team from an amateur one. This level of operational excellence is a major driver of business value. A report by Forrester on the economic impact of a comparable API platform highlighted a 211% ROI for enterprises, driven heavily by improved reliability and a reduction in the time it takes to resolve issues.
Also Read: 346 Country Code: Location, Region, and Dialing Guide
Conclusion
Building a real-time voice AI is a thrilling and rewarding challenge. But the journey doesn’t end when you deploy your code. For a production-grade application, the discipline of monitoring and troubleshooting is just as important as the initial development.
By instrumenting your application to track the “golden signals,” by choosing a voice API for developers that provides deep, transparent observability tools, and by having a clear, methodical troubleshooting plan, you can ensure that your voice application is not just intelligent, but also relentlessly reliable.
Want a personalized tour of our real-time monitoring and analytics dashboard? Schedule a demo for FreJun Teler.
Also Read: How to Choose the Best Click to Call Software for Your Business
Frequently Asked Questions (FAQs)
The Mean Opinion Score (MOS) is the most important, user-centric metric. It is an industry-standard score from 1 to 5 that provides a holistic measure of the perceived audio quality of a call.
These are two key network metrics that affect call quality. Packet Loss is the percentage of audio data packets that are lost in transit over the internet. Jitter is the variation in the arrival time of those packets. High levels of either will result in choppy, garbled audio.
A CDR is a detailed log that is generated for every single phone call. An enterprise-grade voice API for developers will provide a rich CDR that includes timestamps, quality metrics (like MOS), and metadata about the call.
Monitoring is about tracking predefined metrics to see if your system is working (e.g., “Is the server’s CPU too high?”). Observability is a deeper practice that involves instrumenting your system to collect detailed logs and traces so that you can ask new, exploratory questions to understand why it isn’t working.
In your application’s code, you should “wrap” every API call to your external AI models with timers. You should log the latency of every single one of these calls so you can track its performance (especially the p95 and p99 latency) over time.
The “p95 latency” is a statistical measure that means “95% of requests were faster than this value.” It’s a much more useful metric than a simple “average” because it helps you understand the worst-case experience that a significant portion of your users are having.
A good voice API provider will offer a proactive alerting feature. You can set up rules (e.g., “notify me if the average MOS drops below 3.5 for more than 5 minutes”) and have the platform automatically send you an email or a webhook.
A status page is a public web page where a service provider posts real-time information about the health of their systems and any ongoing incidents. It should be the first place you check if you suspect a problem with your voice API.
FreJun AI believes in a “glass box” approach. We provide our users with a comprehensive suite of observability tools, including a real-time analytics dashboard, detailed Call Detail Records for every call with advanced quality metrics, and proactive alerting, giving you the deep visibility you need to operate a reliable service.
The first step is to define your Service Level Objectives (SLOs). These are the specific, measurable targets that you are committing to for your application’s performance (e.g., “Our end-to-end latency for 95% of calls will be below 800ms”). Your entire monitoring plan will be designed to track your performance against these SLOs.